Introduction
Many industries can benefit by utilizing Python for geospatial data analysis. Python is a high-level programming language popular for its ease of use and extensive library support. It has several pre-built libraries in many domains like machine learning, data analytics, statistics, GIS, and remote sensing that make our lives easy. Geospatial data analysis is the process of analyzing data that contains geographical components. With Python’s wide range of libraries, it is easier to handle spatial data efficiently. These libraries cover everything from basic data handling to advanced analysis and visualization.
We are going to explore key Python libraries with real-world use cases, example codes, and outputs.
1. GeoPandas: Handling Vector Data
Use Case: Urban Planning
GeoPandas extends the Pandas library to work with geospatial data. It simplifies operations on geometries like points, lines, and polygons. Urban planners can use it to manage shapefiles of roads, zoning areas, and building footprints.
Code
import geopandas as gpd

# Reading a shapefile of city zones
zones = gpd.read_file('/content/city_zones.shp')

# Plotting the zones
zones.plot(cmap='Set3')Output:

GeoPandas displayed a map of the city zones of Pakistan with each area color-coded.
2. Rasterio: Working with Raster Data
Use Case: Satellite Imagery Analysis
Rasterio specializes in working with raster data (e.g., satellite imagery). It allows users to read, write, and manipulate large raster datasets efficiently, such as elevation models or vegetation indexes like normalized difference vegetation index (NDVI).
Code
pip install rasterio

import rasterio
from rasterio.plot import show

# Open a satellite image
with rasterio.open('satellite_image.tif') as src:
    show(src)
Output

A visual representation of the satellite image has been shown as output, useful for environmental monitoring or land use classification.
3. Shapely: Geometric Operations
Use Case: Buffer Analysis in Environmental Impact Studies
Shapely provides geometric operations like buffering, intersecting, and merging shapes. It is widely used in environmental studies to analyze areas impacted by new developments.
Code
from shapely.geometry import LineString

# Create a LineString
line = LineString([(0, 0), (1, 1), (2, 2)])

# Buffer the LineString by 500 meters
buffer = line.buffer(500)

# Print area of the buffer
print(buffer.area)Output:

Shapely outputs the area of the buffered line, which can represent the zone of impact around a road.
4. Fiona: Reading and Writing Spatial Data
Use Case: Converting Data Formats for Data Interchange
Fiona is used to read and write spatial data in formats like shapefiles, GeoJSON, and more. For example, if you have received spatial data in GeoJSON format but need it as a shapefile for GIS software, Fiona handles the conversion.
Code
import fiona

# Reading a GeoJSON file
with fiona.open('data.geojson', 'r') as source:
    print(source.schema)

# Converting to Shapefile
with fiona.open('output_shapefile.shp', 'w', driver='ESRI Shapefile', schema=source.schema) as sink:
    for feat in source:
        sink.write(feat)
Output
As an output, Fiona will convert the input GeoJSON into a shapefile format, enabling further analysis in GIS software.
5. Folium: Interactive Map Visualizations
Use Case: Real-Time Data Mapping
Folium integrates with Leaflet.js for creating interactive maps. It’s perfect for visualizing geospatial data on the web, such as tracking vehicles in real-time or mapping points of interest in a city.
Code
import folium

# Create a map centered on a city
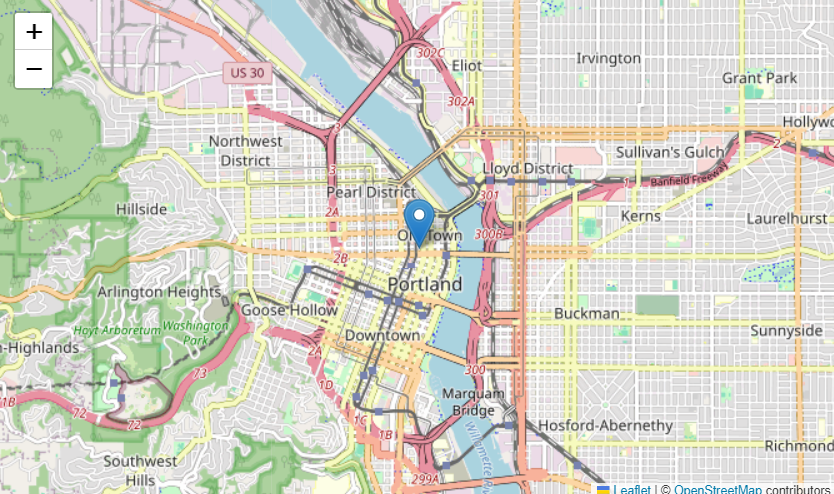
map = folium.Map(location=[45.5236, -122.6750], zoom_start=13)

# Add a marker
folium.Marker([45.5236, -122.6750], popup='Portland').add_to(map)

# Display the map
map
# Save as HTML
map.save('map.html')Output:

An interactive map centered on Portland, USA, will be generated and saved as an HTML file, ready to be embedded in web pages.
6. GDAL: Raster and Vector Data Manipulation
Use Case: Merging Raster Datasets
GDAL (Geospatial Data Abstraction Library) is the backbone for many geospatial libraries and provides tools to manipulate raster and vector datasets. It is particularly useful for complex tasks like raster merging or creating custom projections.
Code
import subprocess

# Use GDAL to merge two raster images
subprocess.run(['gdal_merge.py', '-o', 'merged.tif', 'image1.tif', 'image2.tif'])Output:
Two raster files will be merged into a single file, useful for satellite data processing or large-scale mapping.
7. PyProj: Coordinate Transformation
Use Case: Converting GPS Coordinates
PyProj handles map projections and coordinate transformations. It is essential when working with geospatial datasets that use different coordinate systems, such as converting GPS coordinates (WGS84) to UTM.
Code
from pyproj import Proj, transform

# WGS84 to UTM conversion
wgs84 = Proj(init='epsg:4326')
utm = Proj(init='epsg:32633')

# Convert coordinates
x, y = transform(wgs84, utm, 12.4924, 41.8902)  # Rome, Italy
print(f"Converted coordinates: {x}, {y}")Output:
The GPS coordinates of Rome will be converted from WGS84 to UTM, which is required for accurate distance and area calculations.
8. Matplotlib: Geospatial Data Visualization
Use Case: Creating Custom Geospatial Plots
Matplotlib is a flexible plotting library that can be used to visualize geospatial data with more control over the aesthetics and customization, making it ideal for static map generation.
Code
import matplotlib.pyplot as plt
import geopandas as gpd

# Load USA shapefile
USA = gpd.read_file('/content/USA_adm2.shp')

# Create the plot with more customization
fig, ax = plt.subplots(figsize=(16, 12))  # Larger figure size
USA.plot(ax=ax, cmap='Blues', edgecolor='black', linewidth=0.5, alpha=0.9)

# Customize the look
ax.set_title('USA Administrative Boundaries', fontsize=20, fontweight='bold')  # Bigger title
ax.set_axis_off()  # Hide axis for a cleaner map

# Show the plot
plt.show()Output:

This output illustrates the aesthetic representation of geospatial data of the USA.
Conclusion
By leveraging Python’s extensive library ecosystem, geospatial data analysis is becoming highly efficient. Each library plays a crucial role, from data manipulation with GeoPandas and rasterio, to advanced visualizations with Folium and Matplotlib. The combination of these libraries empowers geospatial analysts to address complex problems across diverse industrie.


